
The Great Macro Split: Why the 2026 Economy is Defying Every Rulebook
The FOMC meeting on April 29 revealed a central bank in a state of historic fragmentation.

The Great Macro Split: Why the 2026 Economy is Defying Every Rulebook
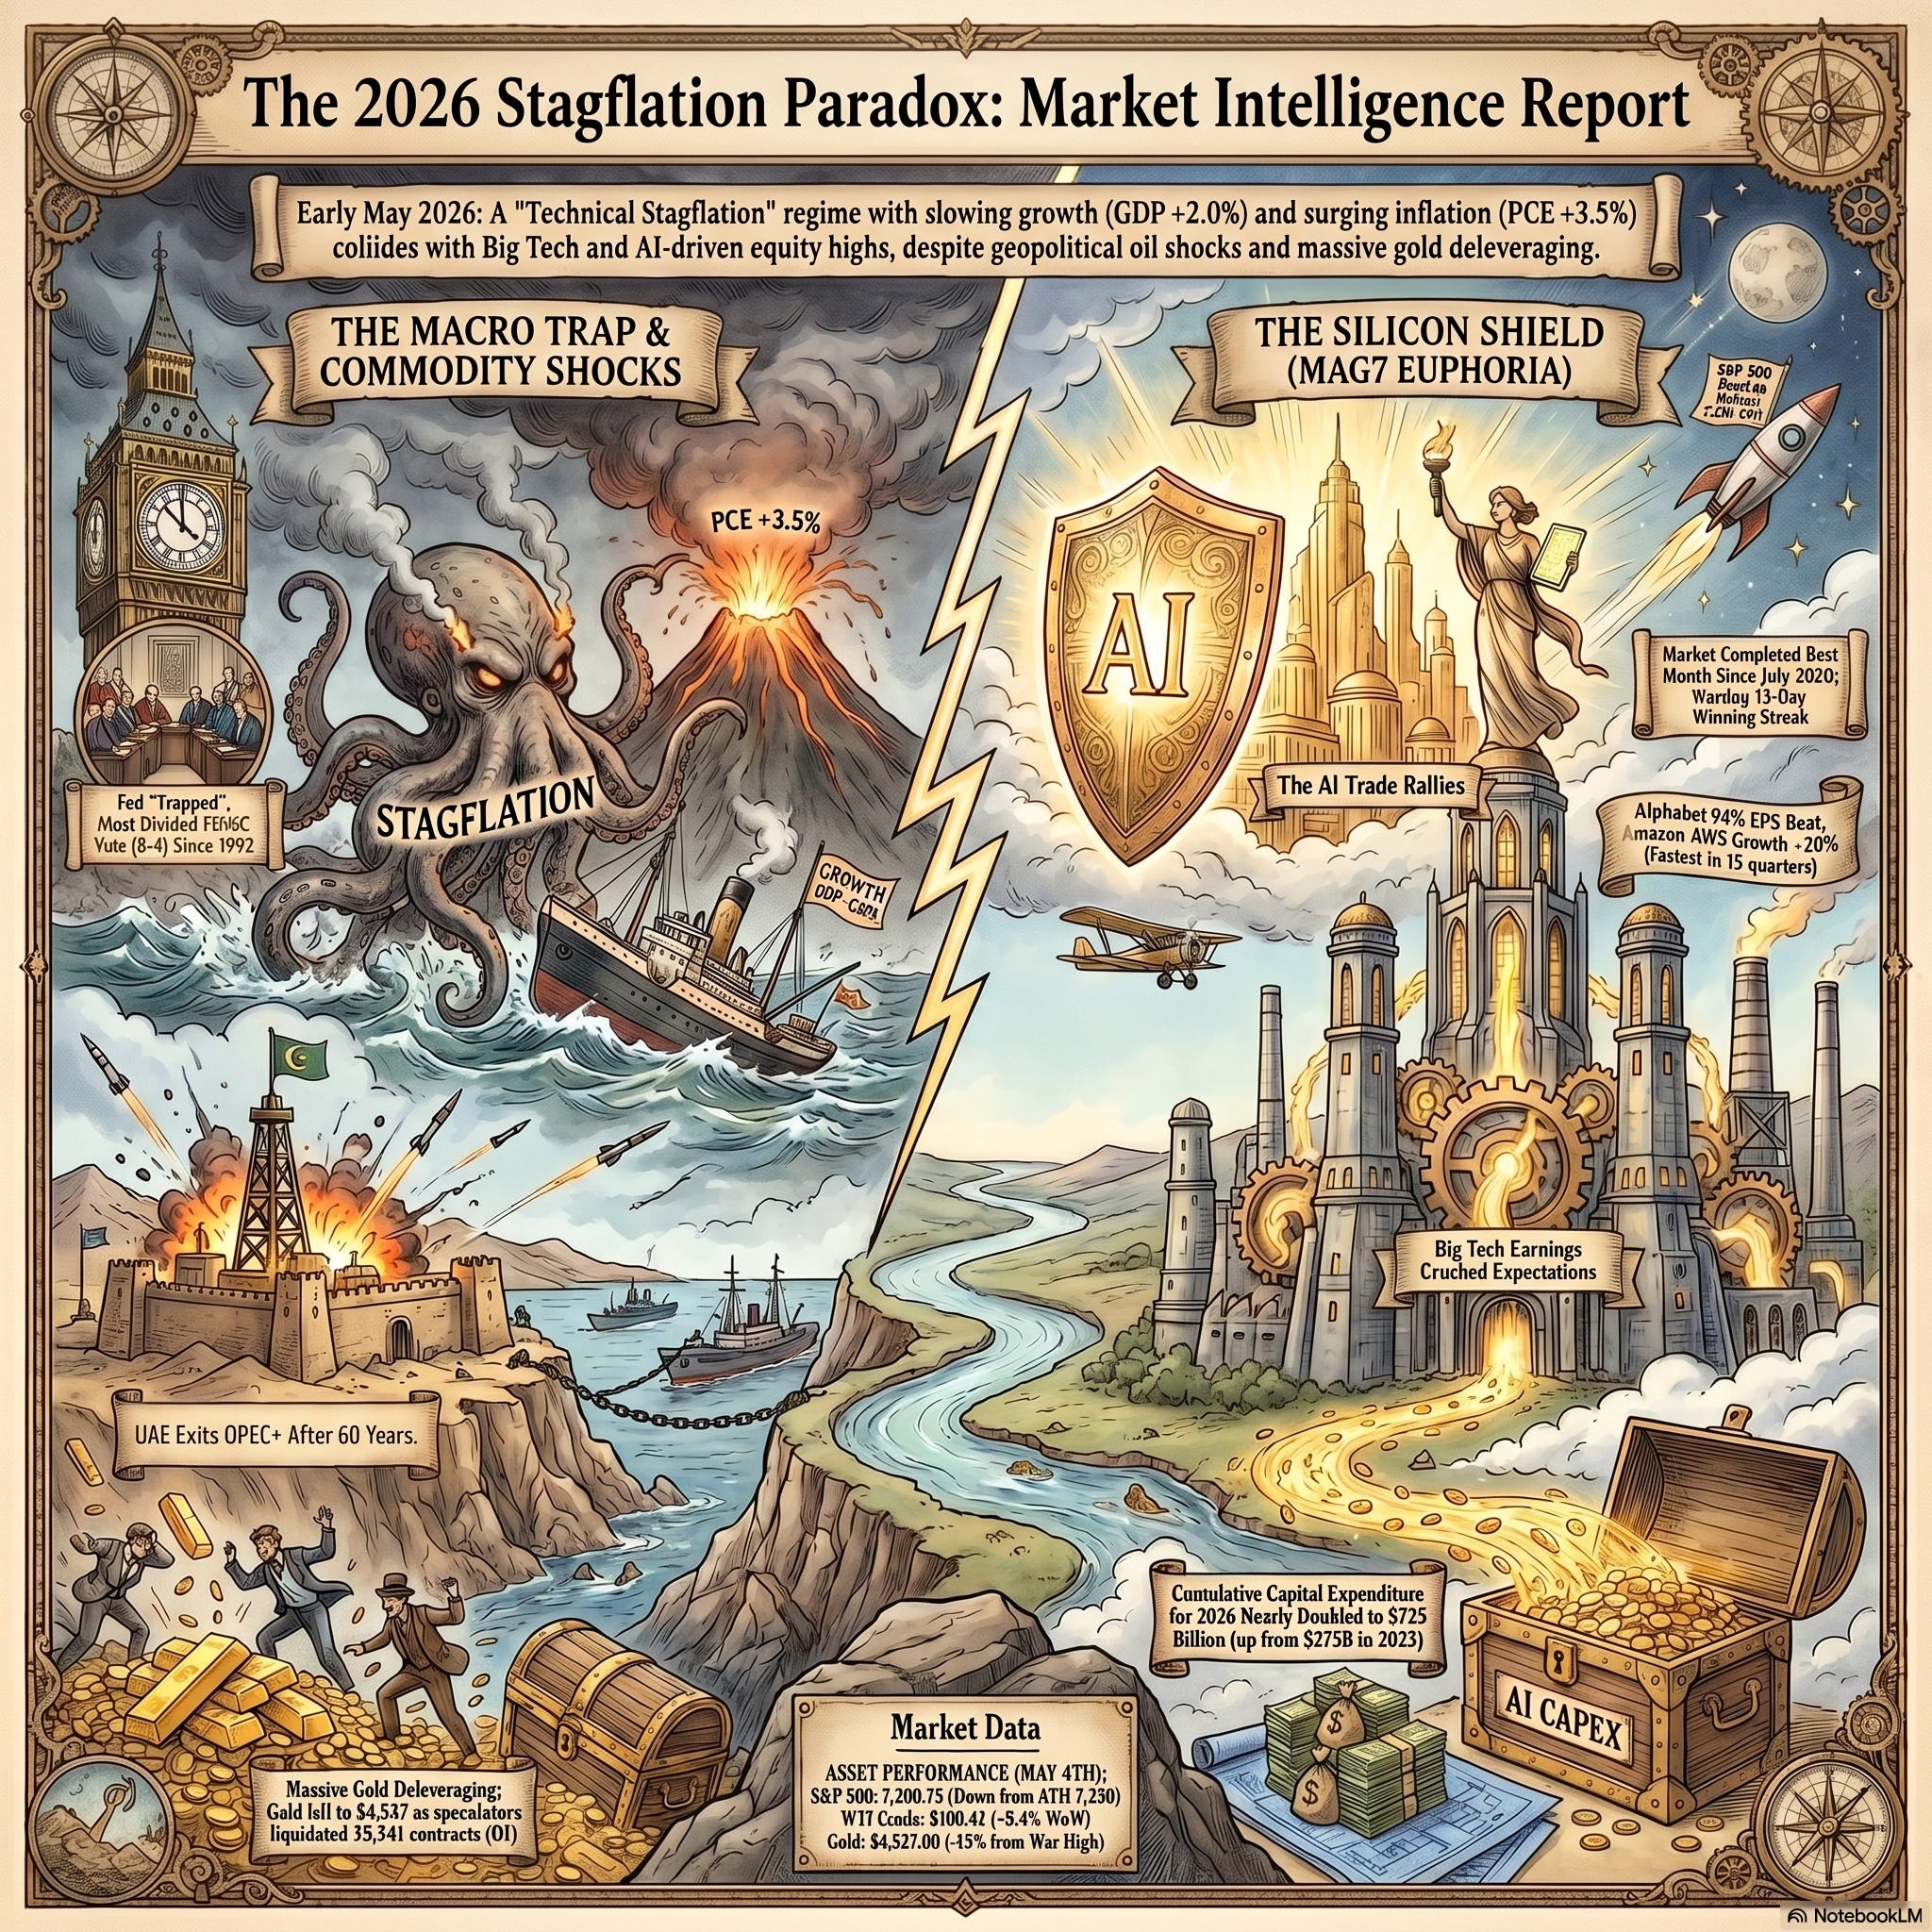
In the world of traditional macroeconomics, certain outcomes are supposed to follow specific signals. High inflation combined with slowing growth—the dreaded “Stagflation”—is typically a death knell for equities. Yet, as of May 6, 2026, the market is staging an impossible juggling act that defies decades of financial precedent. On May 1, the S&P 500 reached a staggering All-Time High (ATH) of 7,230.12, only to pull back slightly to 7,200.75 by May 4 as investors began to hold their breath for a shifting regime.
Despite signals of economic distress that would normally send indices into a tailspin, the market has remained remarkably resilient. We are witnessing a historic divergence: a “Great Split” where the structural costs of the old economy are colliding with the massive capital injections of the AI revolution. This isn’t just a market at a crossroads; it is a market operating on two entirely different tracks, fueled by a central bank in the midst of its most significant internal crisis in a generation.
Understanding this landscape requires moving beyond surface-level headlines and into the technical positioning data driving the Federal Reserve, the energy markets, and the “Hyperscaler” thesis. Here are the five critical takeaways from the current macro landscape.
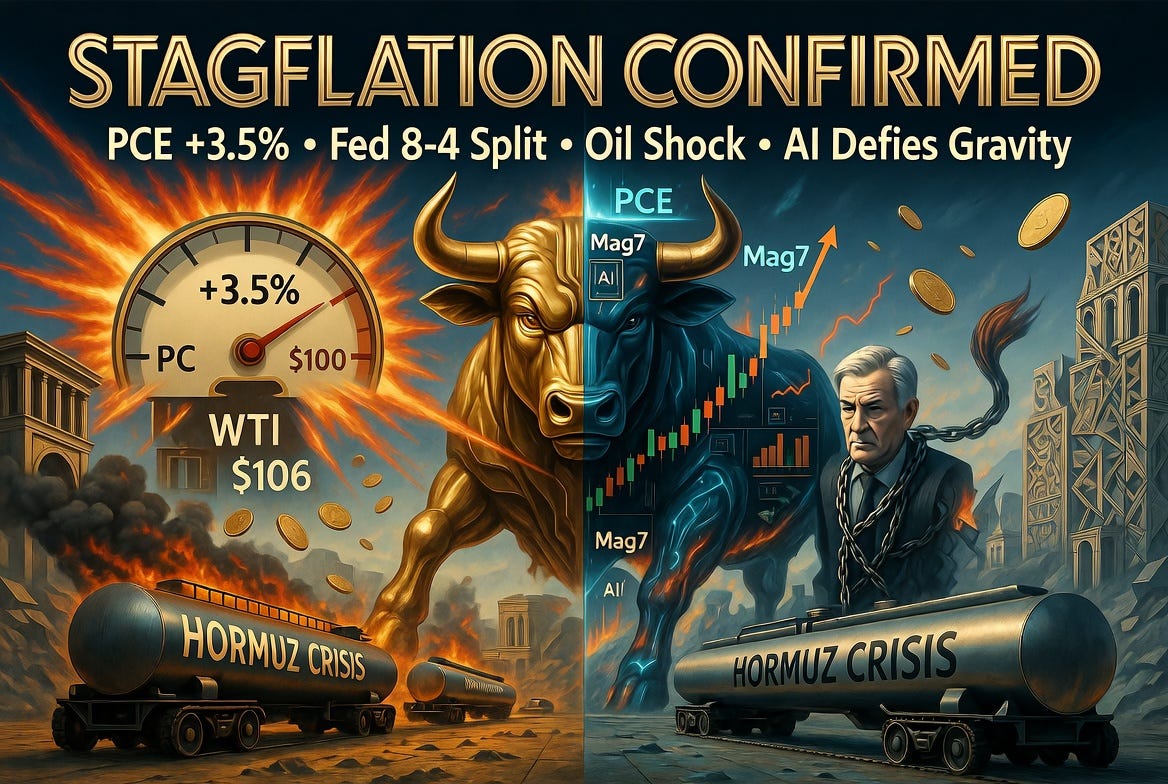
Stagflation is No Longer a Theory—It’s the Technical Reality
For months, the debate over “Technical Stagflation” remained academic. The data released on April 30 has settled the matter. Q1 GDP came in at +2.0%—a figure that technically beat the pessimistic GDPNow estimate of 1.2% but missed the consensus of 2.2%. More importantly, the composition of this growth is incredibly fragile. Much of the headline number was buoyed by AI-related capital expenditure, while consumer spending remained weak, hampered by Winter Storm Fern, which analysts estimate sliced a full 150 basis points off the total growth figure.
The inflationary side of the equation is even more concerning. March PCE (Personal Consumption Expenditures) jumped to +3.5% year-over-year, the highest level since August 2023. This was driven by a massive +11.6% monthly spike in energy costs. The result is a classic cost-push shock, vividly illustrated by the ISM Manufacturing “Stagflationary Split”: Prices Paid have soared to a 4-year high of 84.6%, while the Employment index has contracted to 46.4%.
This data effectively “traps” the Federal Reserve. They are facing growth that is too fragile to justify higher rates, yet inflation that is too high to allow for cuts.
The Fed’s Internal Civil War (The 8-4 Split)
The FOMC meeting on April 29 revealed a central bank in a state of historic fragmentation. The vote to hold rates at 3.5–3.75% was an 8-4 split, the most divided committee since 1992. This is no longer a unified body; it is a central bank at war with itself as it nears a massive leadership transition.
The committee has fractured into three distinct camps:
The Status Quo (8 Votes): The majority who voted to “hold” as they await more data, paralyzed by the conflicting signals of the PCE and ISM data.
The Hawkish Guard (3 Votes): Dissenters who want to remove the “easing bias” entirely, arguing that energy-driven inflation requires an immediate return to a tightening stance.
The Dovish Ghost (1 Vote): Stephen Miran, often characterized as a “Trump stooge,” cast a lone vote for a 25-basis-point cut. However, his influence is over; Miran is now officially out.
The real focus has shifted to May 15. Kevin Warsh has been approved by the Senate Banking Committee on a razor-thin 13-11 party-line vote to succeed Jerome Powell. In a move to protect the Fed’s independence during this volatile transition, Powell is expected to remain on the board.
The AI Shield: Mag7 Capex as the Market’s New Foundation
If stagflation is the weight dragging the economy down, the “Hyperscaler thesis” is the engine keeping the S&P 500 afloat. Earnings beats from Alphabet (GOOGL), Amazon (AMZN), and Apple (AAPL) have single-handedly masked broader market weakness.
Alphabet’s results were particularly staggering, with an EPS of $5.11 against expectations of 2.63. However, the most vital piece of data for the strategist is Alphabet’s **460 billion backlog**, which has nearly doubled. This suggests that the AI trade is no longer speculative—it is anchored in future guaranteed revenue. Alongside Alphabet, Meta and Microsoft have also aggressively raised their 2026 Capex guidance, bringing the Magnificent Seven’s projected cumulative spend to a massive $725 billion for the year.
By the Numbers:
Alphabet EPS Beat: $5.11 vs. $2.63 (+94% vs. consensus)
Alphabet Backlog: $460 Billion (Nearly doubled)
AWS Growth: +28% (Fastest in 15 quarters)
Mag7 2026 Capex: $725 Billion (+93% vs. 2025)
The 60-Year Divorce: UAE Leaves OPEC+
A massive structural wildcard hit the energy markets on May 1 when the United Arab Emirates officially left OPEC+, ending a 60-year partnership. This exit has introduced deep uncertainty into the discipline of the oil cartel.
Geopolitical volatility acted as the immediate catalyst for price action. Following the UAE’s intercept of Iranian missiles on May 4, WTI crude surged to $106.42, with Brent hitting an intraday peak of $126 during the week. This “war premium” is the primary driver behind the 11.6% monthly jump in energy prices, feeding directly into the stagflation narrative and making the Fed’s job of cooling the PCE nearly impossible.
The Gold Paradox: High Inflation, Low Interest
Typically, high inflation is a catalyst for Gold. However, we are currently seeing a “Gold Paradox” where prices have dropped roughly 13% from their war-time highs, sitting near $4,527. The Commitment of Traders (COT) data from April 28 reveals a “structural emptying” of the market. Open Interest (OI) in Gold combined F&O has collapsed by 35,341 contracts—the largest liquidation of the year.
This phenomenon is driven by Deleveraging. To a general investor, this means market participants are not just rotating their money; they are closing out positions entirely and exiting. Speculators are fleeing because a “trapped Fed” means interest rates—and therefore yields—will stay higher for longer.
The market is currently experiencing a “Bear Steepening,” where long-term yields (the 10Y UST at 4.38%) are rising faster than short-term yields. This makes the “opportunity cost” of holding non-yielding assets like Gold and Silver too high. Silver is even more structurally fragile, with an Open Interest collapse of -23,870. The fact that Commercials are reducing their hedging (covering shorts) indicates they are positioning for even lower prices ahead.
Conclusion: The May 15 Turning Point
The “Great Split” is a precarious balance between AI-driven productivity and the structural drag of energy-driven inflation. The market is now singular in its focus on May 15—the day Kevin Warsh takes the helm at the Fed.
Two scenarios now dominate the outlook:
The Bull Scenario: A “Pragmatic Warsh” avoids immediate hawkish shocks, while a major wildcard—negotiations in Pakistan—leads to an extended ceasefire between Iran and its adversaries, allowing oil prices to stabilize.
The Bear Scenario: An “Ultra-Hawkish Warsh” moves to kill inflation by aggressively hiking rates, potentially triggering a deep recession as the “AI shield” fails to protect a broader economy already weakened by high costs and the aftermath of Winter Storm Fern.
As we move toward mid-May, the central question remains: Can AI productivity truly outrun the structural weight of stagflation, or is the market simply ignoring a reality that the new Fed leadership will be forced to confront with a heavy hand?